What we learned from a whole-of-gym Open 26 benchmark
The Open is the one moment a year your whole gym gets measured against everyone else on earth, on the same workouts. With all three Open 26 workouts in Strong AI Insights, the data at our The Yard pilot cohort said something most people got wrong about themselves: they had more in the tank than they let themselves use.
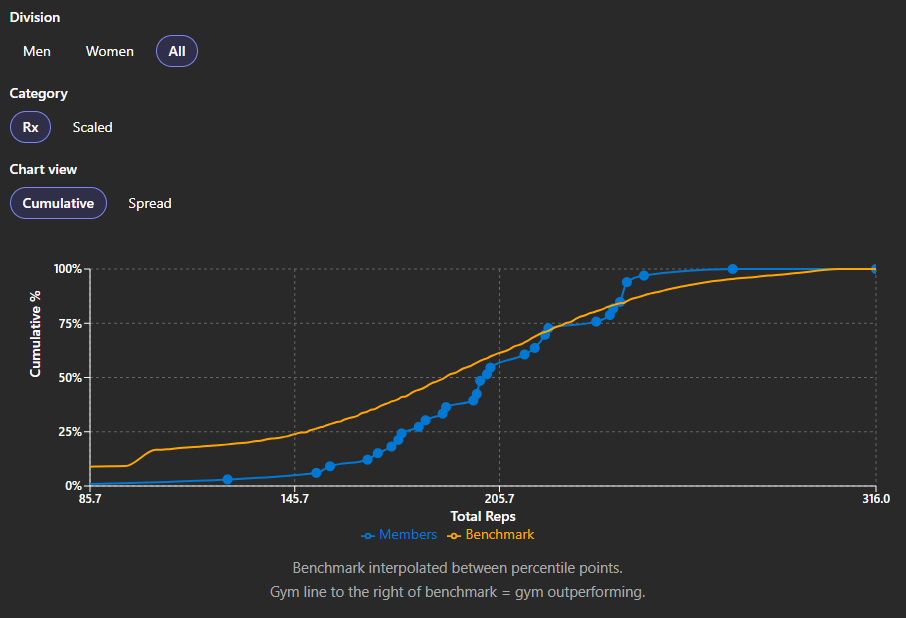
Members can run with the best
At The Yard, the best male and female athletes were globally competitive through Open 26.1 — you can see it on the rep-distribution chart above, with strong performers sitting alongside worldwide benchmarks rather than off on a separate island.
For a gym, that is a valuable proof point when accomplished athletes come to look round: it speaks to the programming and the community, not just a handful of outliers. The whole cohort picture makes that case in data, not only in a tour or a sales conversation.
Why a whole-gym benchmark matters
Most gyms collect Open scores in spreadsheets or whiteboard photos. Strong AI Insights lets you see the whole cohort together — rep distributions against global benchmarks, power output across workouts, and division/category splits — so patterns show up that individual scores hide.
This article summarises what we saw across 26.1, 26.2 and 26.3 at The Yard and Crank London pilot gym (51 athletes on 26.2, 61 on 26.3, 64 on 26.1 in the dataset we analysed).
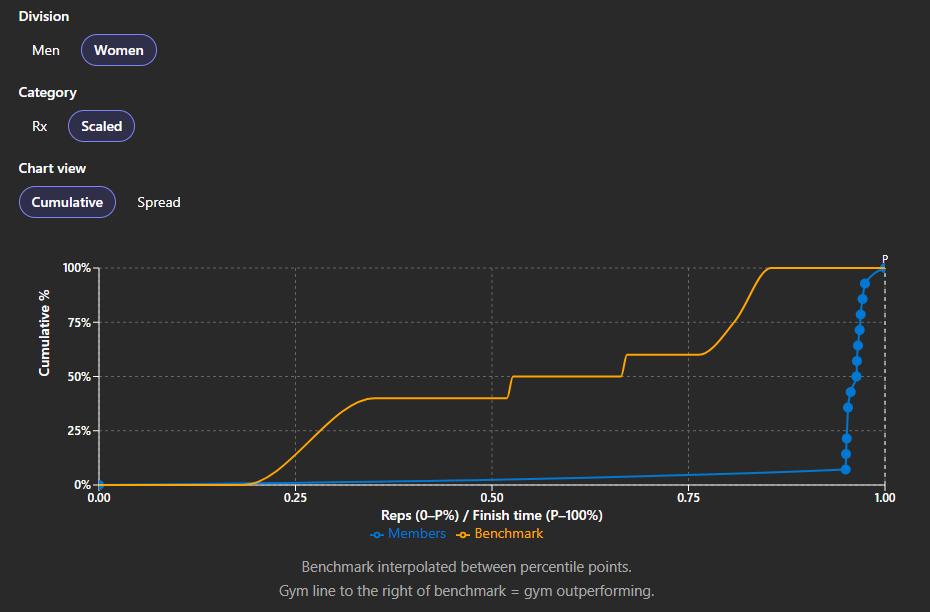
Over-scaling cost more than the movements
26.2 was the most gymnastics-heavy test of the three. In our pilot cohort, 78% of women and 61% of men recorded a Scaled score on 26.2. On the longer engine workout 26.3, those shares fell to 63% and 54% respectively — still high, but meaningfully lower than 26.2.
That gap suggests Rx gymnastics standards held back athletes who had enough capacity to attempt them, especially on 26.2 and disproportionately among women. The rep-distribution charts in Insights make the split visible workout by workout.
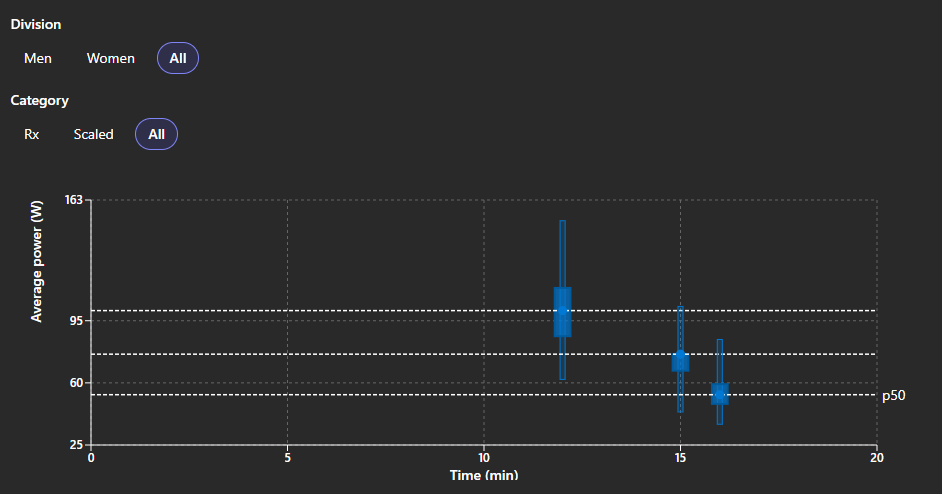
Power pacing changed workout to workout
Average power (watts) is not directly comparable across Open workouts — time domains and movement mix differ — but the gym-wide profile still tells a story. Median average power in our cohort was 101W on 26.1, 76W on 26.2 and 53W on 26.3.
Coaches reading the Power Benchmarks view saw athletes under-pacing complex, shorter intervals where they still had headroom, then facing a different challenge on the longer 26.3 engine test. The constraint was often delivering capacity on skill-heavy work under fatigue, not a lack of raw engine.
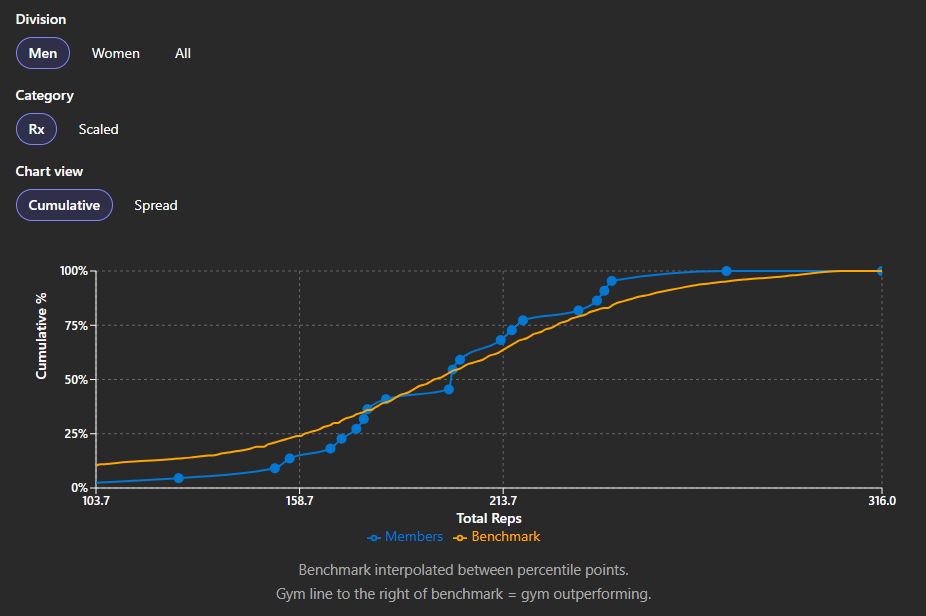
Staple movements carried most of the room
On 26.1, most athletes landed in the middle rep-percentile bands against global benchmarks — not the extreme top or bottom tiers. For anyone below the very top tier, staple movements and consistent capacity did most of the work; exotic skills were rarely the differentiator.
That matches what coaches see on the floor: the Open rewards decisions under fatigue — when to go Rx, when to break sets, when to push — more than any single party-trick movement.
Decisions under fatigue, not fitness in isolation
Across all three workouts, the constraint was rarely fitness in isolation. It was scaling choices, skill execution and pacing when tired. Whole-gym analytics turn that from locker-room hindsight into evidence you can plan from.
If you run a CrossFit, performance or community gym and want the same lens on your next benchmark block, Strong AI Insights is built for exactly this kind of review.
Plan your next training block from gym-wide evidence
See how Strong AI Insights turns Open scores, programming and operations data into clear action for coaches and owners.